Coople reporting
- B2B
- HR-tech
- reporting

We replaced a manual CSV export workflow with a self-serve reporting hub.
I designed and led end-to-end as both PM and designer, prototyped with real components in Claude Code, and shipped with engineering support.
- Client
- Coople
- Role
- Senior Product Designer, Product Manager
- Duration
- 4 months
- Year
- 2026
- Team
- 2 members: full stack developer and me
Overview
Coople's Operations team was spending hours every week manually pulling data and rebuilding the same reports for enterprise clients. There was no central place for the recurring questions, and no way for clients to manage their own scheduling without going through ops.
I led this end-to-end — identifying the problem, writing the PRD, running discovery, and designing both the reporting hub and a scheduling feature. Just two of us: me and a full-stack developer.
To keep feedback loops tight, I prototyped key interactions using Claude Code with Coople's actual component library. Testing felt like the real product, and by the time we wrote a spec, the handoff was already component-aligned.
The result: four structured reports with consistent metric definitions, self-serve exports, and a scheduling feature that gave enterprise clients direct control over their workforce planning — for the first time.
- Reports shipped
- 4
- Ops time saved
- ~6h / week
- Enterprise adoption
- 100%
Labor, Feedback, Usage, Worker Overview
per enterprise account vs. manual CSV workflow
of pilot clients active in first month
Discovery
I kicked off discovery with competitor research, using Claude to identify the strongest workforce management tools with reporting features — then investigated each product myself to understand what reports they offered and how detailed they were.
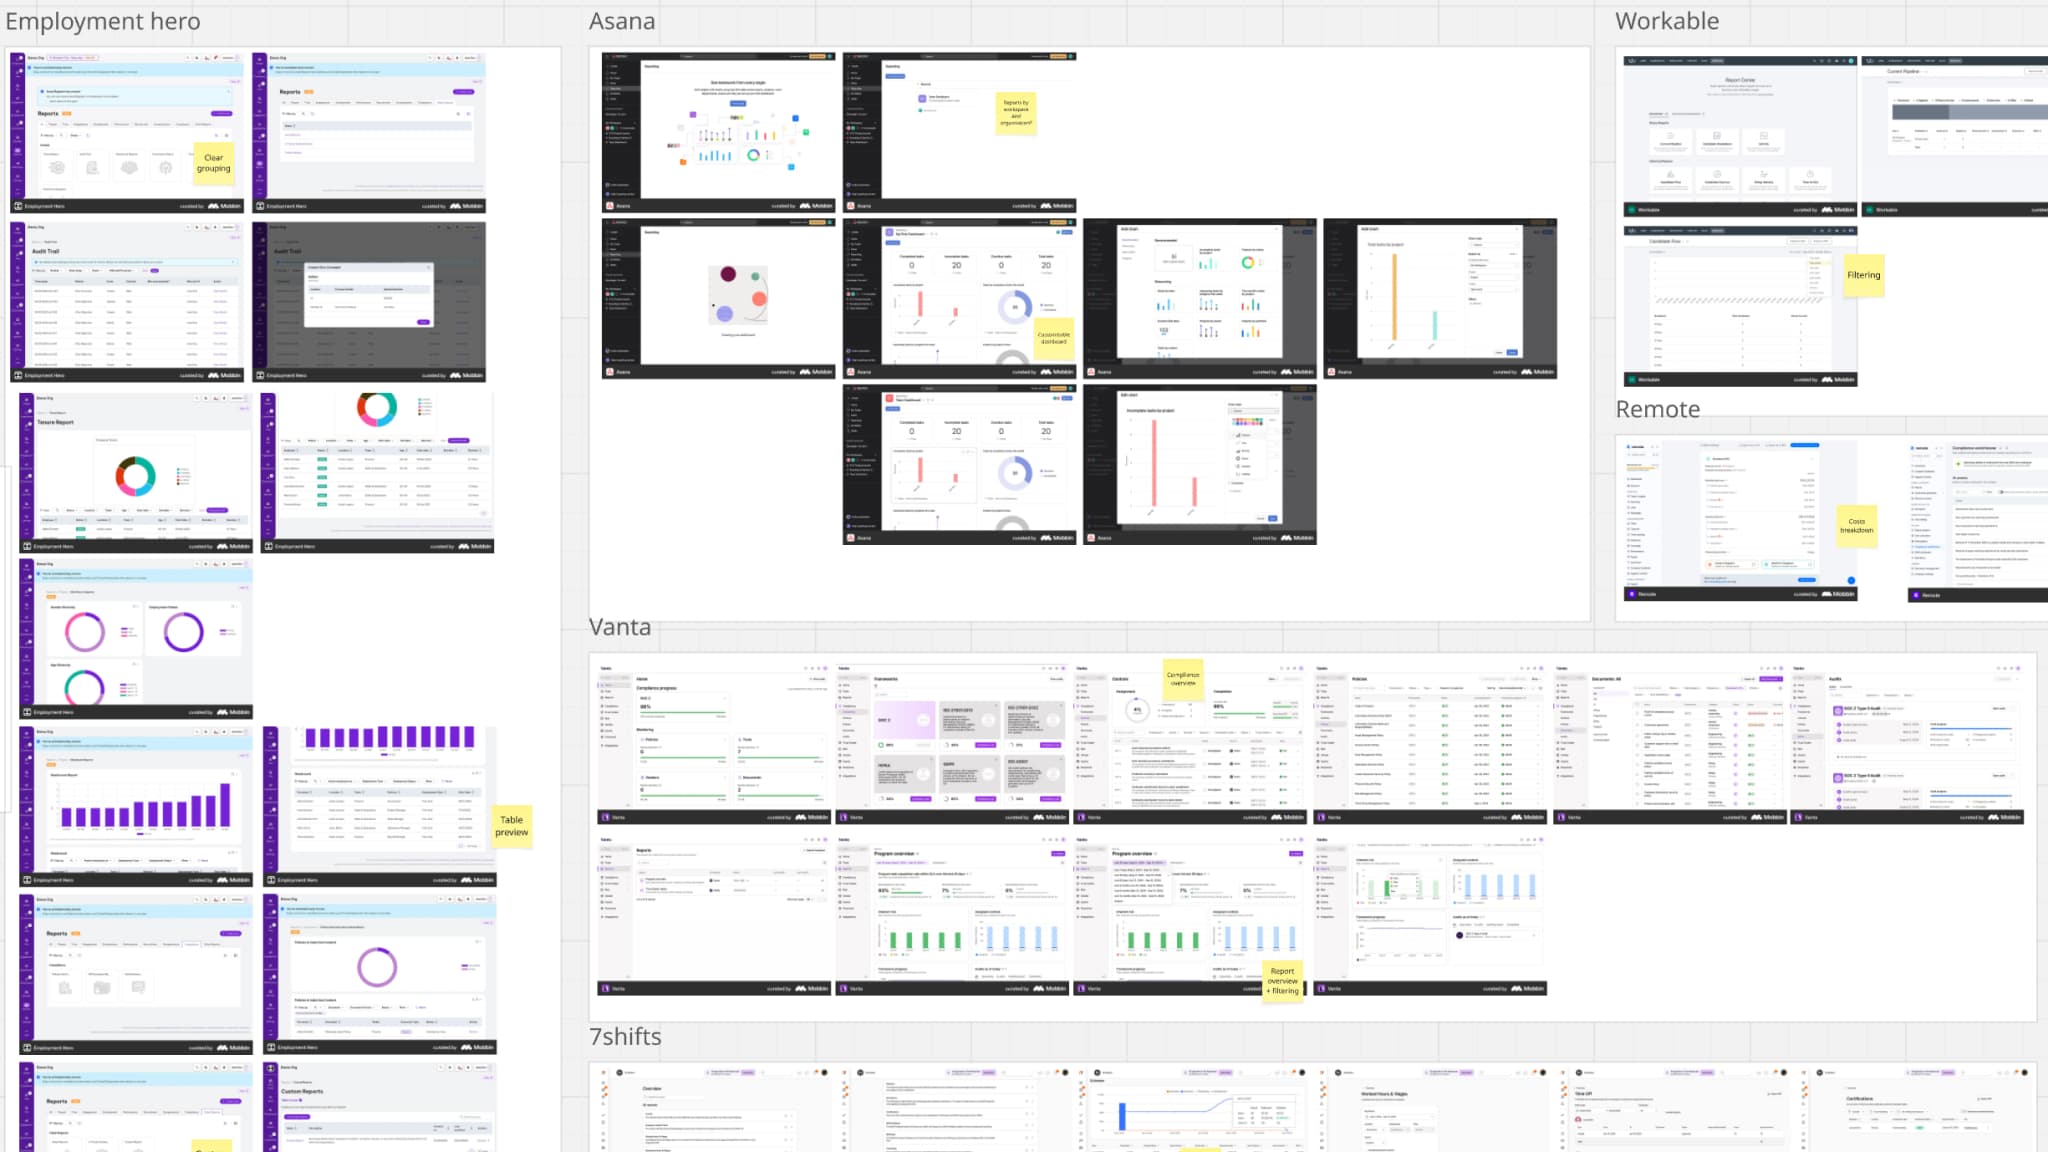
Competitor teardown — annotated reporting screens from workforce and adjacent tools, grouped by product.
That research also helped me prepare for sessions with our ops team — the people who were manually building and delivering these reports to clients. Rather than scheduling a meeting cold, I set up a dedicated Slack channel first, asking them to share which reports they thought we should prioritize and why. It gave people time to think, and meant the session itself was already warm.
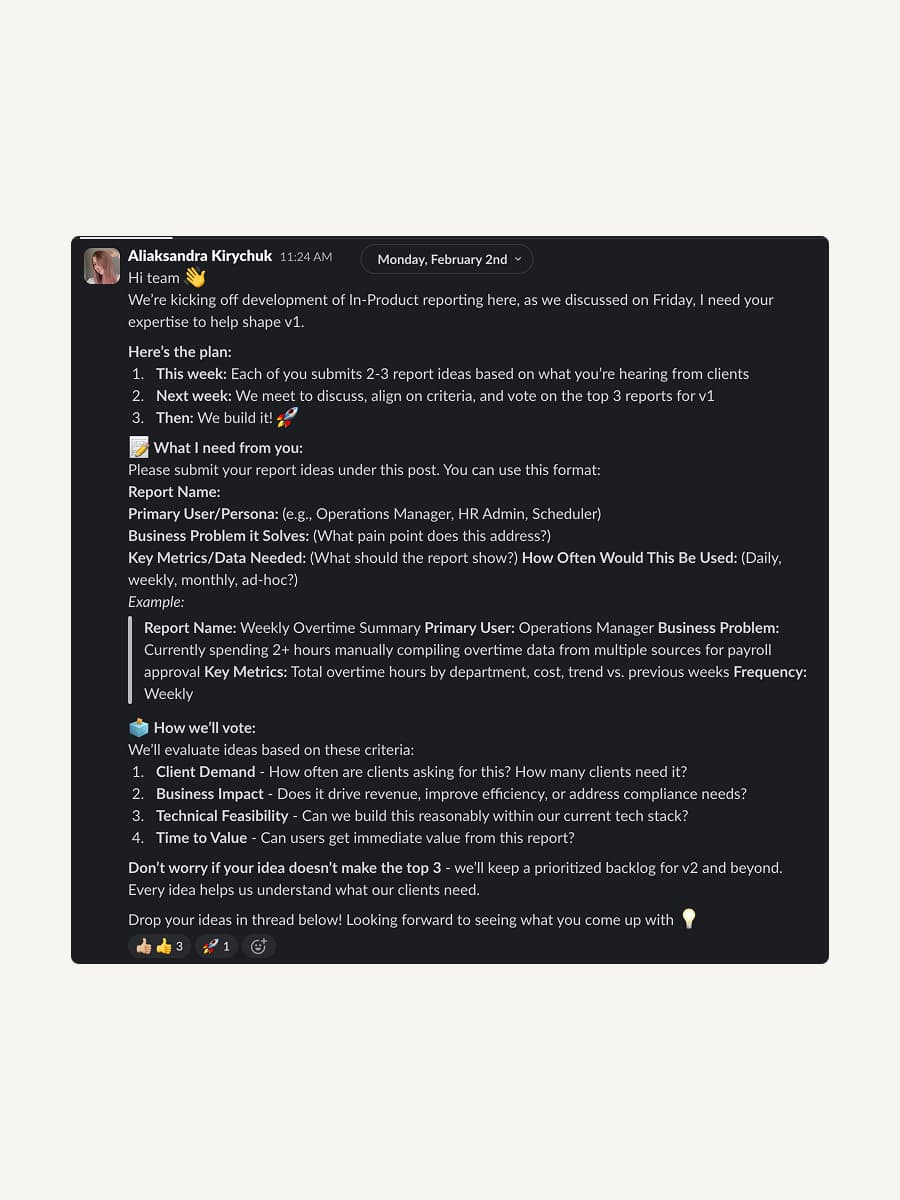
The kickoff post that primed the ops team.
From there I pulled everything into a Miro board — their ideas, my findings from competitor research, and insights from earlier interviews. We walked through it together, discussed, and voted. By the end we had a clear, shared picture of what the first version of reporting needed to cover.
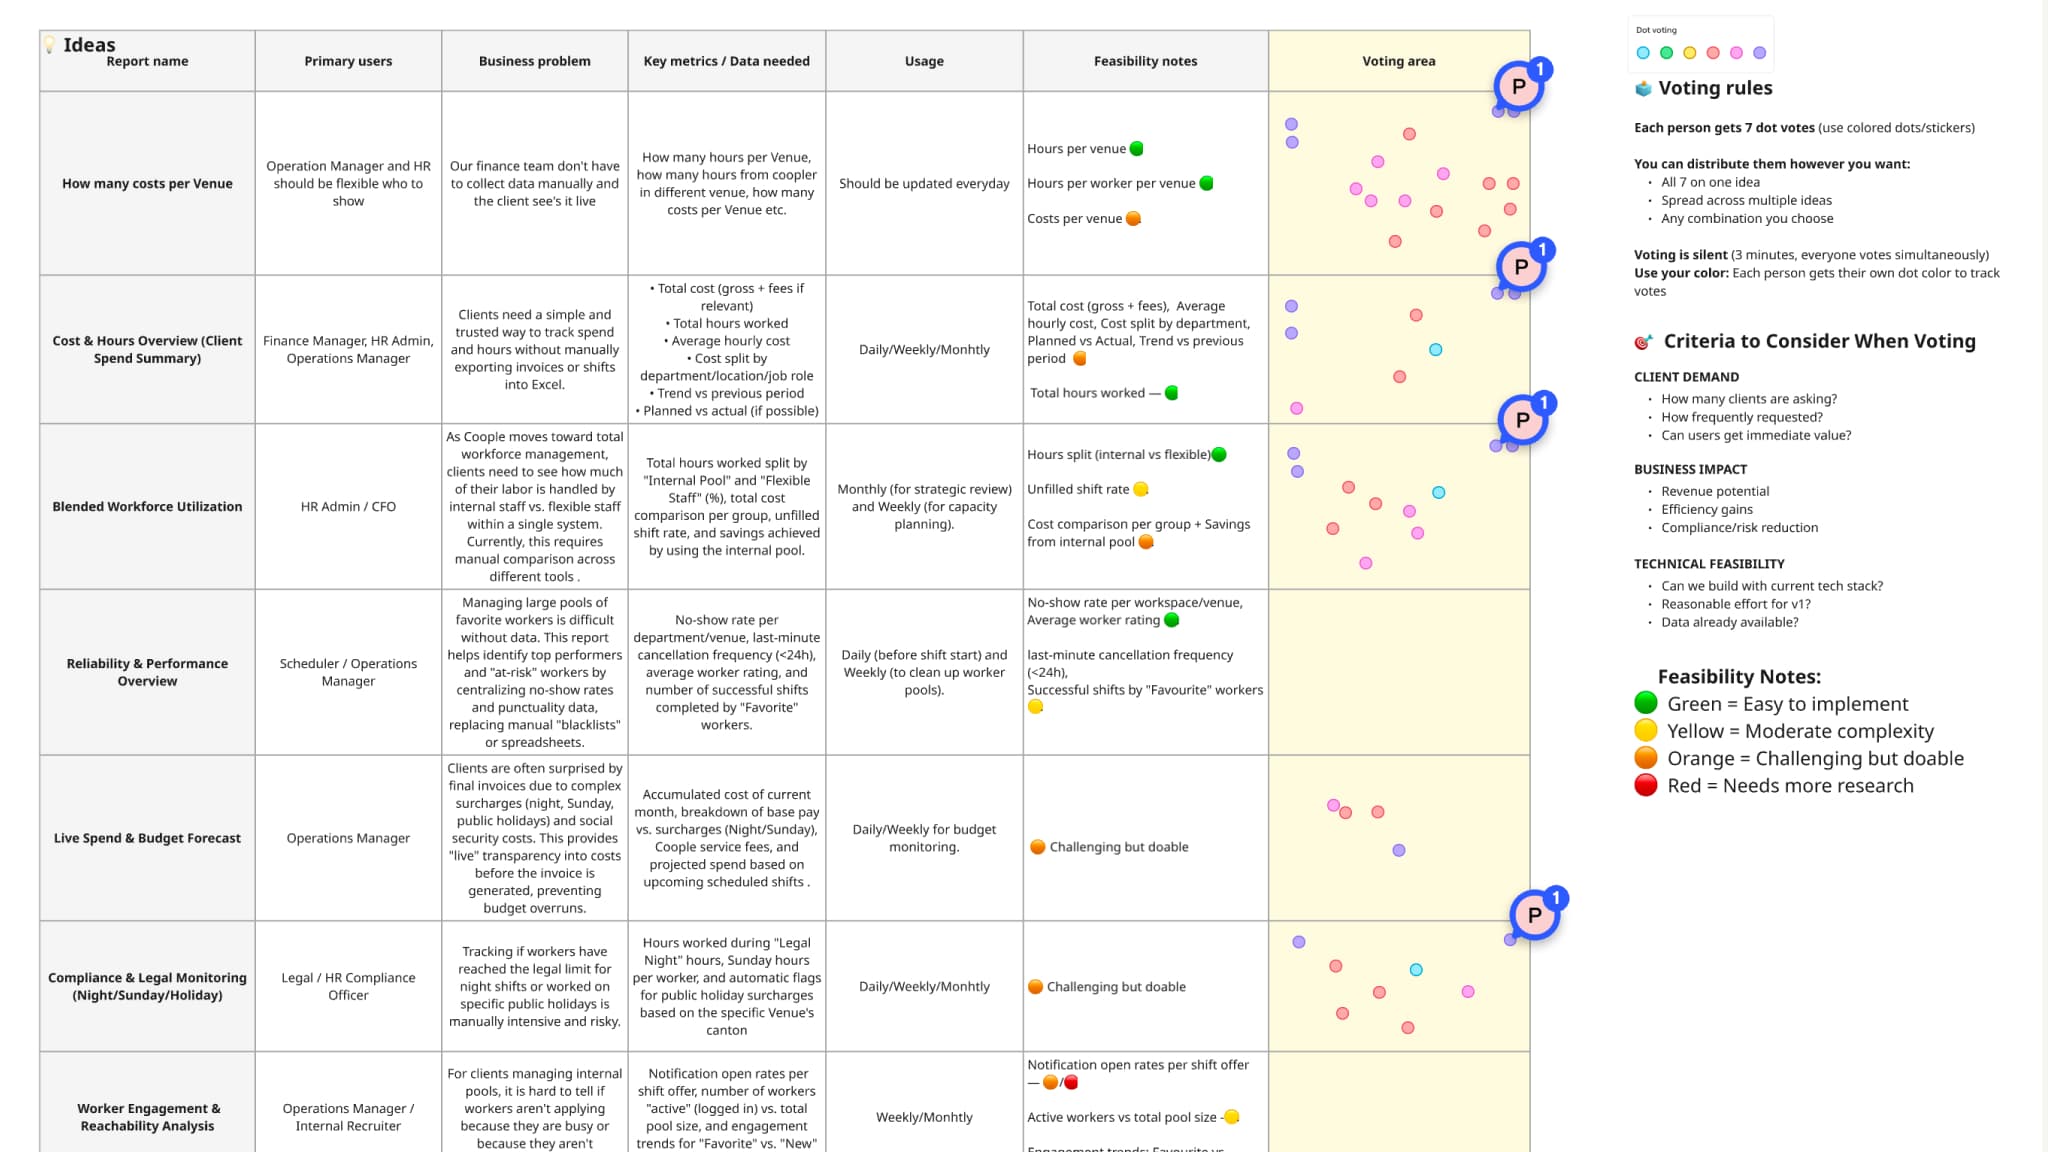
The Miro board we clustered and dot-voted on to lock the first version's scope.
Concepts and testing
After the first ops session, I put together an initial version of the reporting section. A static Figma prototype wasn't going to cut it. So I built a working version using Claude Code with Coople's actual component library. What we tested felt like the real product, not a simulation.
It also made the engineering handoff cleaner — the components were already production-aligned, so nothing needed to be reinterpreted from a spec. Before the next session, I recorded a walkthrough of the prototype and posted it in the feedback channel. It gave the ops team time to form a first impression and come to the session already prepared — which made the conversation much more focused.
Mockups
The design centers on a Reports Hub — an entry page with a top-level KPI strip and preview cards for each report. The goal was to make it feel like a daily command center, not just a navigation menu.
Each report follows the same structure: filters at the top, a KPI strip, charts for trend and pattern recognition, and a drilldown table for the detail work. The Workforce Breakdown table in Labor Overview, for example, lets you drill from venue to role to individual worker — so a manager can go from "we're 12% under plan" to "here's exactly who and where" without leaving the page.
Every metric tile links to a plain-language definition. That was a deliberate design decision, not a tooltip afterthought.
Every team defined the same metric differently
Challenge
Operations, finance, and enterprise clients each calculated fill rate a different way. Without a shared definition, the same number on the same screen meant three different things depending on who was reading it — and people defaulted back to Excel because they didn't trust what the product showed them.
Solution
Treated the metric dictionary as a first-class part of the product. Every KPI tile links to a plain-language definition surfaced inline, so the canonical calculation lives next to the number rather than buried in a help doc. For a reporting product, the dictionary turned out to be more load-bearing than the charts.
Final testing
A round of task-based testing with Operations and two enterprise clients validated the IA before lock. Refinements focused on the filter bar (sticky on scroll, with active filters always visible) and on the empty states for newly created reports, which testers consistently misread as broken queries.
Challenges and Learnings
The hardest design problem wasn't the layout — it was metric governance. Every team at Coople had a slightly different definition of fill rate. Operations calculated it one way, finance another, enterprise clients a third. We couldn't just pick one and move on; we had to surface the canonical definition next to each metric so users could trust what they were looking at. That ended up being more valuable than the charts themselves. For a reporting product, the metric dictionary is the product. If users don't trust the number, they go back to Excel. Using Claude Code to prototype with real components also changed how I caught problems. The empty state issue and the sticky filter bar — both of which came up in final testing — were things I'd already seen and fixed once during the build phase, precisely because I was working in a live environment rather than a Figma frame. It compressed the feedback loop in a way that static design tools can't. Running this project as both PM and designer taught me something about scope. Having full ownership made decision-making fast — no handoffs, no misalignments between the PRD and the design. But it also meant I had to be more disciplined about what didn't make it into V1. The roadmap beyond V1 only stayed out of scope because I'd written the rationale for it myself.
Next steps
The immediate next phase is report subscriptions — so customers can receive a report on a schedule instead of opening it manually. After that, the same component set extends to worker-side reporting once the metric definitions stabilize across teams. Longer term, the permissions layer needs to be designed carefully: cost data, wage factors, and PII have different visibility rules depending on whether you're an ops user or an enterprise client. That's the problem I'd want to solve before expanding reporting depth further.